Django Prometheus + Grafana + Node exporter
Intro
Django API의 요청 수, 응답 시간 등을 수집하고 시각화하여 모니터링 하기 위해 django prometheus, Grafana를 사용하고자 했다.
- django-prometheus는 Django 애플리케이션에서 쉽게 Prometheus 메트릭을 수집할 수 있도록 설정을 제공한다.
- 수집된 메트릭은 Prometheus로 전송되며, Prometheus와 Grafana는 쉽게 연동되어 메트릭 데이터를 시각화할 수 있다.
Prometheus + Grafana docker
django가 돌아가지 않는 별도의 서버에 아래 docker 구성으로 Prometheus와 Grafana를 서비스를 띄워준다.
version: "3.8"

networks:
  monitoring:
    driver: bridge

services:
  prometheus:
    image: prom/prometheus:latest
    container_name: prometheus
    networks:
      - monitoring
    volumes:
      - ./prometheus/prometheus.yml:/etc/prometheus/prometheus.yml
    ports:
      - "9090:9090"
    command:
      - "--config.file=/etc/prometheus/prometheus.yml"

  grafana:
    image: grafana/grafana:latest
    container_name: grafana
    networks:
      - monitoring
    ports:
      - "3000:3000"
    environment:
      - GF_SECURITY_ADMIN_USER=abcde
      - GF_SECURITY_ADMIN_PASSWORD=123123123
Node Exporter 설치 (선택)
만약 Django API 메트릭이 아닌 시스템의 메모리나 CPU 상태를 모니터링하고 싶다면 django가 돌아가고 있는 서버에 Node Export를 별도로 설치해준다. 아래는 docker로 설치하는 방법이다.
  services:

	  node-exporter:
	    image: prom/node-exporter:latest
	    container_name: node-exporter
	    networks:
	      - monitoring
	    ports:
	      - "9100:9100"
	    command:
	      - "--path.procfs=/host/proc"
	      - "--path.sysfs=/host/sys"
	    volumes:
	      - /proc:/host/proc:ro
	      - /sys:/host/sys:ro
	      - /:/rootfs:ro
django prometheus 모듈 설치 및 앱에 추가
pip install django-prometheus
# settings.py
INSTALLED_APPS = [
   ...
   'django_prometheus',
   ...
]


MIDDLEWARE = [
    'django_prometheus.middleware.PrometheusBeforeMiddleware',
    ...
    ]


# urls.py
urlpatterns = [
    ...
    path('', include('django_prometheus.urls')),
]
Prometheus 적용 결과
http://localhost:9090/target -> 해당되는 IP주소로 변경한 후 9090포트에서 확인 할 수 있다.
Grafana Prometheus 연동
http://localhost:3000으로 접속하여 Grafana를 실행한다.
Data source에서 add new data source를 클릭

prometheus 선택

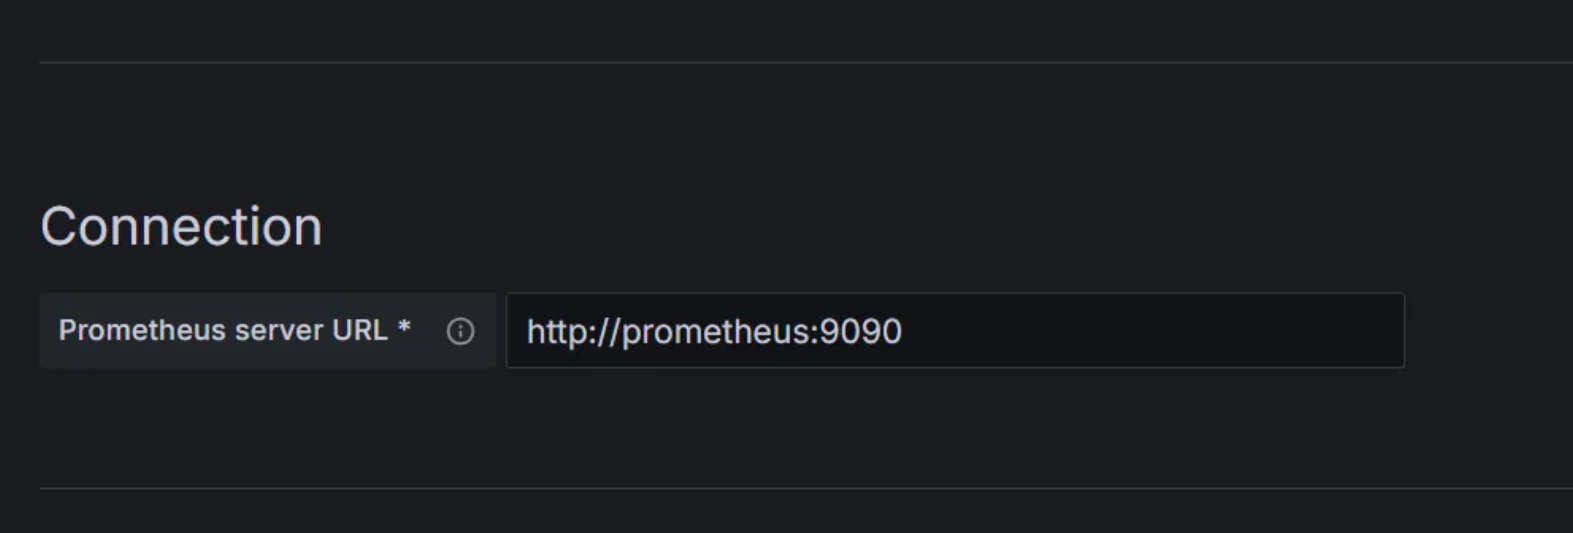
docker로 추가할 경우 docker 컨테이너 서비스명을 host ip로 사용
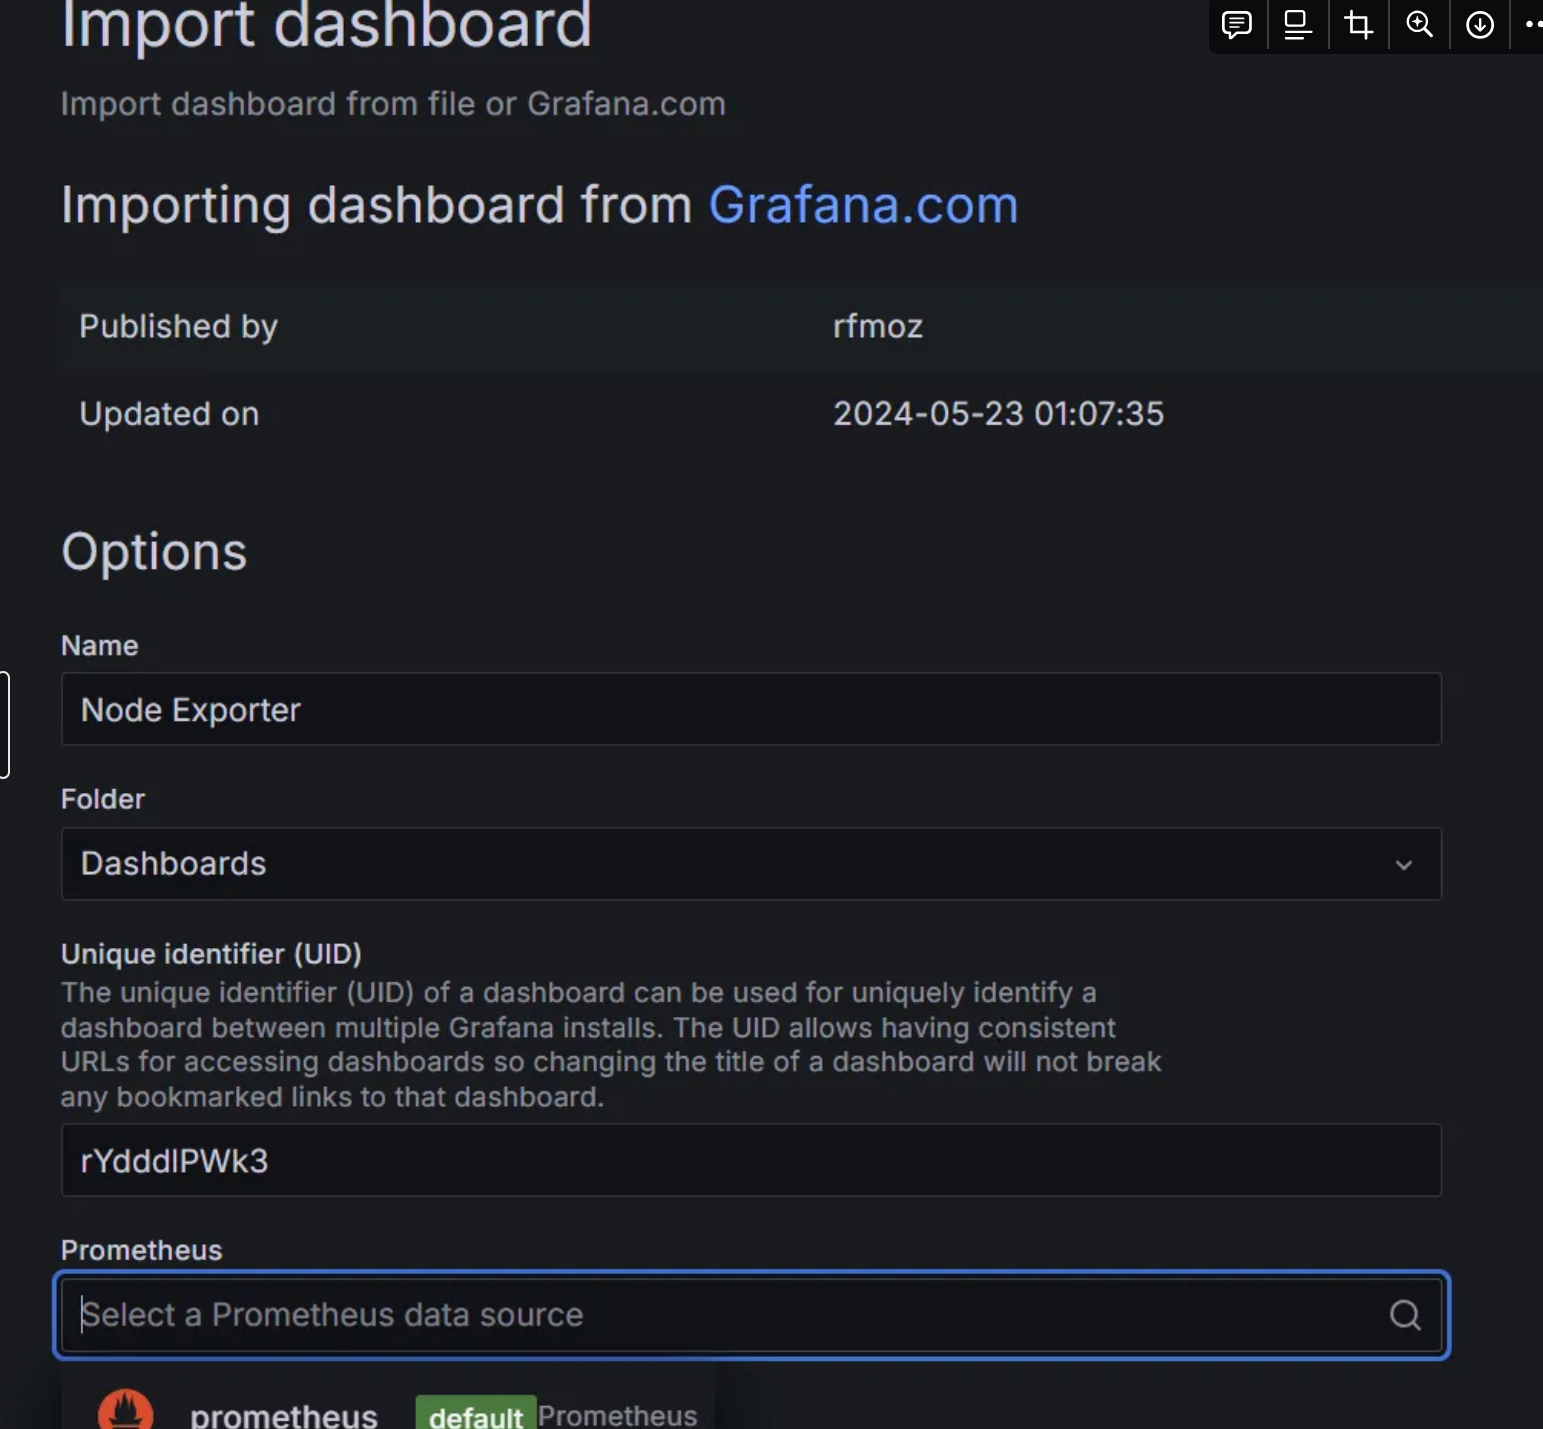
Dashboard 추가하기 > Import dashboard

dashboard template ID를 입력하여 Load 하여 json을 불러오거나 json 자체를 다운받아 Load 할 수 있다.
- Grafana에서 Create -> Import로 이동합니다.
- 템플릿 ID로 1860을 입력하고 Load 버튼을 클릭합니다.
- Prometheus 데이터 소스를 선택한 후 Import를 누르면 Node Exporter의 다양한 메트릭(메모리, CPU 등)이 포함된 대시보드를 바로 사용할 수 있습니다.

Grafana Django template
https://grafana.com/grafana/dashboards/17658-django/
Prometheus 원하는 것으로 Datasource 만들어놓은 것을 지정하면 된다.
Dashboard 추가하기
Import dashboard
dashboard template ID를 입력하여 Load 하여 json을 불러오거나 json 자체를 다운받아 Load 할 수 있다.
- Grafana에서 Create -> Import로 이동합니다.
- 템플릿 ID로 1860을 입력하고 Load 버튼을 클릭합니다.
- Prometheus 데이터 소스를 선택한 후 Import를 누르면 Node Exporter의 다양한 메트릭(메모리, CPU 등)이 포함된 대시보드를 바로 사용할 수 있습니다.
Grafana Django template
https://grafana.com/grafana/dashboards/17658-django/
Prometheus 원하는 것으로 Datasource 만들어놓은 것을 지정하면 된다.